- “One of the most important price patterns looks like a cup with a handle when the outline of the cup is viewed from the side. Cup patterns can last from 7 weeks to as long as 65 weeks, but most of them last for three to six months. The usual correction from the absolute peak (the top of the cup) to the low point (the bottom of the cup) of this price pattern varies from around the 12% to 15% range to upwards of 33%. A strong price pattern of any type should always have a clear and definite price uptrend prior to the beginning of its base pattern. You should look for at least a 30% increase in price in the prior uptrend, together with improving relative strength and a very substantial increase in trading volume at some points in the prior uptrend. In most, but not all, cases, the bottom part of the cup should be rounded and give the appearance of a “U” rather than a very narrow “V.” This characteristic allows the stock time to proceed through a needed natural correction,
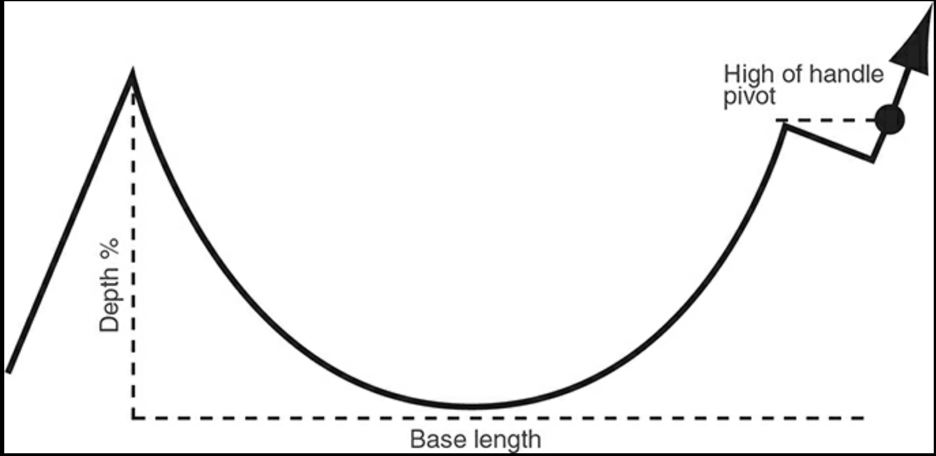
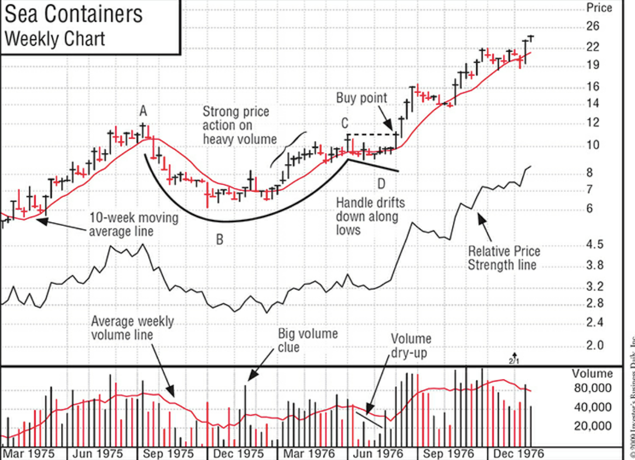

- “The formation of the handle area generally takes more than one or two weeks and has a downward price drift or “shakeout” (where the price drops below a prior low point in the handle made a few weeks earlier), usually near the end of its down-drifting price movement. Volume may dry up noticeably near the lows in the handle’s price pullback phase.”
- “Your objective isn’t to buy at the cheapest price or near the low, but to begin buying at exactly the right time, when your chances for success are greatest. This means that you have to learn to wait for a stock to move up and trade at your buy point before you make an initial commitment.”
- “Nearly all proper bases will show a dramatic drying up of volume for one or two weeks along the very low of the base pattern and in the low area”
- A good sign when considering buying a stock from a volume perspective is to look at heavy volumes when the stock closes up for the day in the past couple weeks and lower volumes for the stock on down days.
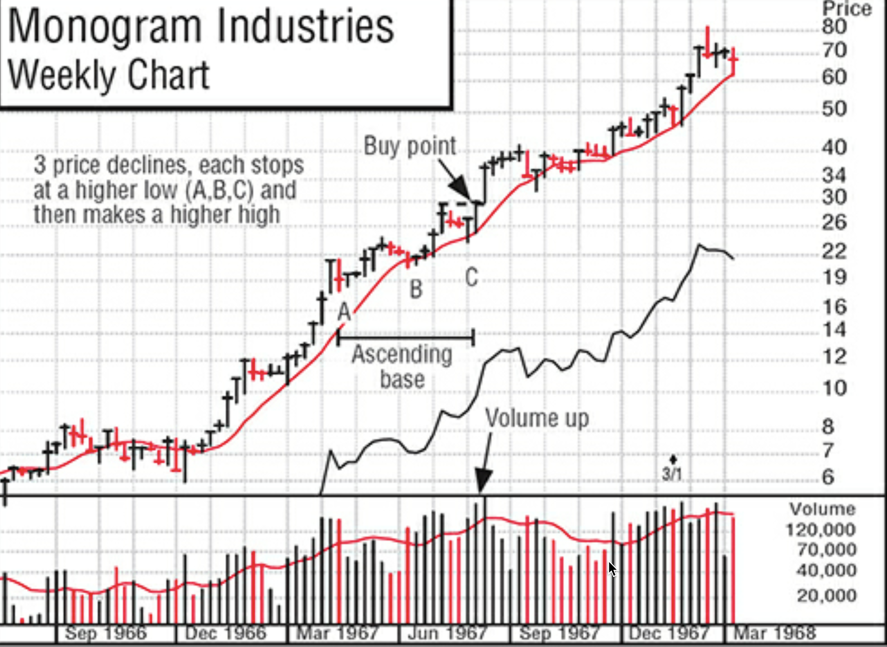
- Ascending bases – higher lows:
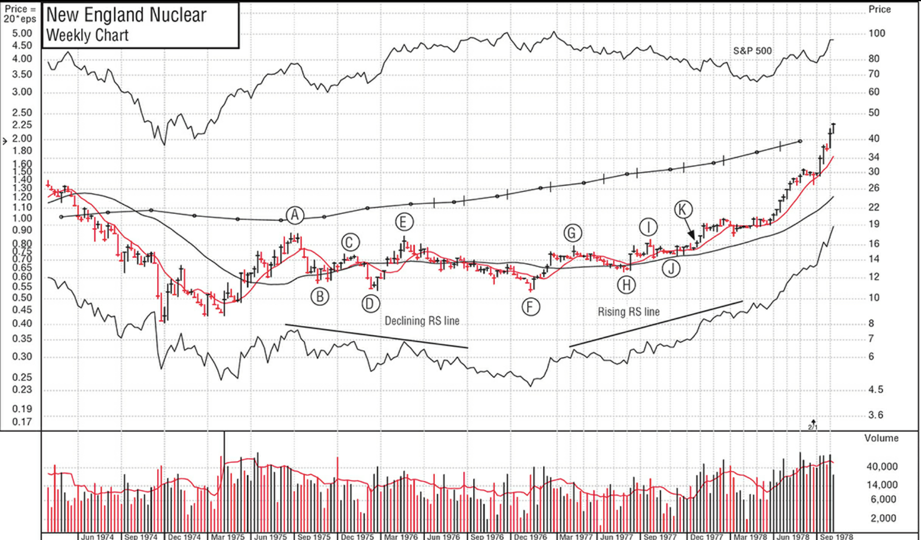
- A W chart pattern formation isn’t enough to determine a buying entry point. It needs to be accompanied with a rising RSI and an increase in volume. See example below for a chart that had a perfect W but
- “Be careful: if you have only a little knowledge of charts, you can misinterpret what is a correct head-and-shoulders top. Many pros don’t interpret the pattern properly. The right (second) shoulder must be slightly below the left shoulder”

- “You should buy stocks that are performing better than the general market just as they are beginning to emerge from sound base-building periods. The time to sell is when the stock has advanced rapidly, is extended materially from its base, and is showing extremely high relative price strength. To recognize the difference, you have to use daily or weekly charts.”
- Overhead Supply occurs when the stock price drops below a certain level, revisits the original level and faces resistance at that price point. Say that a stock goes down from 40 to 25 then revisits the 40, the rally back up could stall at 40. This could be caused by buyers who bought the stock near the 40 range and just wanted to break even on the investment having seen their investment turn south rapidly.
https://www.youtube.com/watch?v=ilcSjEfTl1o - “You absolutely do not buy breakouts during a bear market. Most of them will fail. The price patterns will be too deep, wide, and loose in appearance compared to earlier patterns. They will be third- and fourth-stage bases; have wedging or loose, sloppy handles; have handles in the lower half of the base; or show narrow “V” formations moving straight up from the bottom of a base into new highs, without any handle forming.”
- “The stocks you select should show a major percentage increase in current quarterly earnings per share (the most recently reported quarter) when compared to the prior year’s same quarter.”
- “The key question for the winning investor must always be: How much are the current quarter’s earnings per share up (in percentage terms) from the same quarter the year before?”
- “Whether you’re a new or an experienced investor, I would advise against buying any stock that doesn’t show earnings per share up at least 18% or 20% in the most recent quarter versus the same quarter last year”
- “Some professional investors bought Waste Management at $50 in early 1998 because earnings had jumped three quarters in a row from 24% to 75% and 268%. But sales were up only 5%. Several months later, the stock collapsed to $15 a share. This demonstrates that companies can inflate earnings for a few quarters by reducing costs or spending less on advertising, research and development, and other constructive activities. To be sustainable, however, earnings growth must be caused by growth in sales”
- “Buy stocks with proven records of significant sales and earnings growth in each of the last three years plus strong recent quarterly improvements and a high return on equity. Get the best chart service you can find; learn to spot sound chart patterns and combine your new charting skill with the stocks with great earnings, sales, and return on equity. Don’t accept anything less . . . if you want better results.”
- “Search for companies that have developed important new products or services, or that have benefited from new management or materially improved industry conditions. Then buy their stocks when they are emerging from sound, correctly analyzed price consolidation patterns and are close to, or actually making, new price highs on increased volume.”
- “If you want to upgrade your stock selection so that you’re zeroing in on the leaders, restrict your purchases to companies showing RS Ratings of 80 or higher.”
- “The unwillingness of investors to set and follow minimum standards for stock selection reminds me of doctors years ago who were ignorant of the need to sterilize their instruments before each operation. They kept killing off patients until surgeons finally and begrudgingly accepted studies by researchers Louis Pasteur and Joseph Lister. Ignorance rarely pays off in any walk of life, and it’s no different in the stock market.”
- “Corrections, or price declines, in the general market can help you recognize new leaders—if you know what to look for. The more desirable growth stocks normally correct 1½ to 2½ times the general market averages. In other words, if the overall market comes down 10%, the better growth stocks will correct 15% to 25%. in a correction during a bull, or upward-trending, market, the growth stocks that decline the least (percentagewise) are usually your best selections. Those that drop the most are normally the weakest. Say the general market average suffers an intermediate-term correction of 10%, and three of your successful growth stocks come off 15%, 25%, and 35%. The two that are off only 15% or 25% are likely to be your best investments after they recover”
- “Also in 2000, many people bought Cisco Systems Systems when it dropped to $50 from its early-year high of $82. The maker of computer networking equipment had been a huge winner in the 1990s, when it soared 75,000%, so it looked cheap at $50. It went to $8 and never got back to $50. In 2008, eight years after those buyers saw value at $50, Cisco was selling for only $17.”
- “Suppose Joe Investor missed buying Crocs, the footwear company, at a split-adjusted $15 as it came out of the perfect cup-with-handle pattern in September 2006. Suppose he also missed the next cup pattern in April 2007 at 28. Then the stock roars up to $75 by October, with earnings up 100% every quarter. A month later, however, the stock drops to 47, and Joe sees his chance to get into this big winner that he missed all the way up and that’s now at a cheaper price. But the stock just keeps falling, and by January 2009 it’s trading at $1. Buying stocks on the way down is dangerous. You can get wiped out. So stop this risky bad habit. This is why I say don’t buy a supposed good stock on the way down and why we recommend cutting all losses at 7% or 8%. Any stock can do anything. You must have rules to protect your hard-earned money. We all make mistakes. You must learn to correct yours without vacillating. None of the pros or individual investors who owned or bought Cisco, Crocs, or BofA when they were falling recognized the difference between normal price declines and highly abnormal big-volume corrections that can signal potential disaster.”
- “Diligent investors dig down yet another level. They want to know not only how many institutional sponsors a stock has, but whether that number has steadily increased in recent quarters, and, more important, whether the most recent quarter showed a materially larger increase in the number of owners. They also want to know who those sponsors are, as shown by services reporting this information. In analyzing the recorded quality of a stock’s institutional sponsorship, the latest 12 months plus the last three years of the investment performance of mutual fund sponsors are usually most relevant… buy only those stocks that have at least a few institutional sponsors with better-than-average recent performance records and that have added institutional owners in recent quarters.”
- “You should check earlier cycles to learn the sequence of industry-group moves at various stages of the market cycle. If you do, you’ll see that railroad equipment, machinery, and other capital goods industries are late movers in a business or stock market cycle. This knowledge can help you get a fix on where you are now. When these groups start running up, you know you’re near the end. In early 2000, computer companies supplying Internet capital goods and infrastructure were the last-stage movers, along with telecom and equipment suppliers.”
- “In bear markets, stocks usually open strong and close weak. In bull markets, they tend to open weak and close strong. The general market averages need to be checked every day, since reverses in trends can begin on any given few days.”
- “When the general market tops, you must sell to raise at least some cash and to get off margin (the use of borrowed money) to protect your account. As an individual investor, you can easily raise cash and get out in one or two days, and you can likewise reenter later when the market is finally right. If you don’t sell and raise cash when the general market tops, your diversified list of former market leaders can decline sharply. Several of them may never recover to their former levels. Your best bet is to learn to interpret daily price and volume charts of the key general market averages. If you do, you can’t get too far off-track, and you won’t need much else. It doesn’t pay to argue with the market. Experience teaches that second-guessing the market can be a very expensive mistake.”
- ” After you see the first several definite indications of a market top, don’t wait around. Sell quickly before real weakness develops. When market indexes peak and begin major downside reversals, you should act immediately by putting 25% or more of your portfolio in cash, selling your stocks at market prices. The use of limit orders (buying or selling at a specific price, rather than buying or selling at market prices using market orders) is not recommended. Focus on your ability to get into or out of a stock when you need to. Quibbling over an eighth- or quarter-point (or their decimal equivalents) could make you miss an opportunity to buy or sell a stock. Lightning-fast action is even more critical your stock account is on margin. If your portfolio is fully margined, with half of the money in your stocks borrowed from your broker, a 20% decline in the price of your stocks will cause you to lose 40% of your money. A 50% decline in your stocks could wipe you out! Never, ever try to ride through a bear market on margin.”
- “To detect a market top, keep a close eye on the daily S&P 500, NYSE Composite, Dow 30, and Nasdaq Composite as they work their way higher. On one of the days in the uptrend, volume for the market as a whole will increase from the day before, but the index itself will show stalling action (a significantly smaller price increase for the day compared with the prior day’s much larger price increase). I call this “heavy volume without further price progress”
- “In October 1999, the market took off on a furious advance. Fears of a Y2K meltdown on January 1, 2000, had faded. Companies were announcing strong profits for the third quarter just ended. Both leading tech stocks and speculative Internet and biotechnology issues racked up huge gains in just five months. But cracks started to appear in early March 2000. On March 7, the Nasdaq closed lower on higher volume, the first time it had done so in more than six weeks. That’s unusual action during a roaring bull market, but one day of distribution isn’t significant on its own. Still, it was the first yellow flag and was worth watching carefully. Three days later, the Nasdaq bolted up more than 85 points to a new high in the morning. But it reversed in the afternoon and finished the day up only 2 points on heavy volume that was 13% above average. This was the second warning sign. That churning action (a lot of trading but no real price progress—a clear sign of distribution) was all the more important because leading stocks started showing their own symptoms of hitting climax tops—action that will be discussed in Chapter 11. Just two days later, on March 14, the market closed down 4% on a large volume increase. This was the third major warning signal of distribution and one where you should have been taking some selling action. The index managed to put together a suspect rally from March 16 to 24, then stalled again for a fourth distribution day. It soon ran out of steam and rolled over on heavier volume two days later for a fifth distribution day and a final, definite confirmation of the March 10 top. The market itself was telling you to sell, raise cash, and get out of your stocks.”
- “At some point in every correction—whether that correction is mild or severe—the stock market will always attempt to rally. Don’t jump back in right away. Wait for the market itself to confirm the new uptrend. A rally attempt begins when a major market average closes higher after a decline that happened either earlier in the day or during the previous session. Starting on the fourth day of the attempted rally, look for one of the major averages to “follow through” with a booming gain on heavier volume than the day before. This tells you the rally is far more likely to be real. The most powerful follow-throughs usually occur on the fourth to seventh days of the rally.”
- “The market’s volume for the day should in most cases be above its average daily volume, in addition to always being higher than the prior day’s trading. Occasionally, but rarely, a follow-through occurs as early as the third day of the rally. In such a case, the first, second, and third days must all be very powerful, with a major average up 1½% to 2% or more each session in heavy volume.
Occasionally, but rarely, a follow-through occurs as early as the third day of the rally. In such a case, the first, second, and third days must all be very powerful, with a major average up 1½% to 2% or more each session in heavy volume.” - “Most successful stocks have these seven common characteristics at emerging growth stages, so they are worth committing to memory. Repeat the formula until you can recall and use it easily. Keep it with you when you invest.
C = Current Quarterly Earnings per Share. Quarterly earnings per share must be up at least 18% or 20%, but preferably up 40% to 100% or 200% or more—the higher, the better. They should also be accelerating at some point in recent quarters. Quarterly sales should also be accelerating or up 25% or more.
A = Annual Earnings Increases. There must be significant (25% or more) growth in each of the last three years and a return on equity of 17% or more (with 25% to 50% preferred). If return on equity is too low, pretax profit margin must be strong.
N = New Products, New Management, New Highs. Look for new products or services, new management, or significant new changes in industry conditions. And most important, buy stocks as they emerge from sound, properly formed chart bases and begin to make new highs in price.
S = Supply and Demand—Shares Outstanding plus Big Volume Demand. Any size capitalization is acceptable in today’s new economy as long as a company fits all the other CAN SLIM rules. Look for big volume increases when a stock begins to move out of its basing area.
L = Leader or Laggard. Buy market leaders and avoid laggards. Buy the number one company in its field or space. Most leaders will have Relative Price Strength Ratings of 80 to 90 or higher and composite ratings of 90 or more in bull markets.
I = Institutional Sponsorship. Buy stocks with increasing sponsorship and at least one or two mutual fund owners with top-notch recent performance records. Also look for companies with management ownership. M = Market Direction. Learn to determine the overall market direction by accurately interpreting the daily market indexes’ price and volume movements and the action of individual market leaders. This can determine whether you win big or lose. You need to stay in gear with the market. It doesn’t pay to be mutual fund owners with top-notch recent performance records. Also look for companies with management ownership.
M = Market Direction. Learn to determine the overall market direction by accurately interpreting the daily market indexes’ price and volume movements and the action of individual market leaders. This can determine whether you win big or lose. You need to stay in gear with the market. It doesn’t pay to be out of phase with the market.” - “I like to follow a 3-to-1 ratio between where to sell and take profits and where to cut losses. If you take some 20% to 25% gains, cut your losses at 7% or 8%. If you’re in a bear market like 2008 and you buy any stocks at all, you might get only a few 10% or 15% gains, so I’d move quickly to cut every single loss automatically at 3%”
- “Here’s another suggestion that may help you decide whether to sell: pretend that you don’t own the stock and you have $2,800 in the bank. Then ask yourself, “Do I really want to buy this stock now?” If your answer is no, then why are you holding onto it?”
- “individual investors should sell half of their position in a stock if it is down 5% from their cost and the other half once it’s down 10%. This is sound advice. To preserve your hard-earned money, I think a 7% or 8% loss should be the absolute limit. The average of all your losses should be less, perhaps 5% or 6%, if you’re strictly disciplined and fast”
- “Small losses are cheap insurance, and they’re the only insurance you can buy on your investments. Even if a stock moves up after you sell it, as many surely will, you will have accomplished your critical objective of keeping all your losses small, and you’ll still have money to try again for a winner in another stock.”
- “I suggest you write down the price at which you expect to sell if you have a loss (8% or less below your purchase price) along with the expected profit potential of all the securities you purchase. For instance, you might consider selling your growth stock when its P/E ratio increases 100% or more from the time the stock originally began its big move out of its initial base pattern. If you write these numbers down, you’ll more easily see when the stock has reached one of these levels. It’s bad business to base your sell decisions on your cost and hold stocks down in price simply because you can’t accept the fact you made an imprudent decision.”
- “Largest daily price run-up. If a stock’s price is extended—that is, if it’s had a significant run-up for many months from its buy point off a sound and proper base—and it closes for the day with a larger price increase than on any previous up day since the beginning of the whole move up, watch out! This usually occurs very close to a stock’s peak.
2. Heaviest daily volume. The ultimate top might occur on the heaviest volume day since the beginning of the advance.
3. Exhaustion gap. If a stock that’s been advancing rapidly is greatly extended from its original base many months ago (usually at least 18 weeks out of a first- or second-stage base and 12 weeks or more if it’s out of a later-stage base) and then opens on a gap up in price from the previous day’s close, the advance is near its peak. For example, a two-point gap in a stock’s price after a long run-up would occur if it closed at its high of $50 for the day, then opened the next morning at $52 and held above $52 during the day. This is called an exhaustion gap.
4. Climax top activity. Sell if a stock’s advance gets so active that it has a rapid price run-up for two or three weeks on a weekly chart, or for seven of eight days in a row or eight of ten days on a daily chart. This is called a climax top. The price spread from the stock’s low to its high for the week will almost always be greater than that for any prior week since the beginning of the original move many months ago
5. Signs of distribution. After a long advance, heavy daily volume without further upside price progress signals distribution. Sell your stock before unsuspecting buyers are overwhelmed. Also know when savvy investors are due to have a long-term capital gain.
6. Stock splits. Sell if a stock runs up 25% to 50% for one or two weeks on a stock split.
7. Increase in consecutive down days. For most stocks, the number of consecutive down days in price relative to up days in price will probably increase when the stock starts down from its top. You may see four or five days down, followed by two or three days up, whereas before you would have seen four days up and then two or three down.
8. Upper channel line. You should sell if a stock goes through its upper channel line after a huge run-up. (On a stock chart, channel lines are somewhat parallel lines drawn by connecting the lows of the price pattern with one straight line and then connecting three high points made over the past four to five months with another straIght line)
9. 200-day moving average line. Some stocks may be sold when they are 70% to 100% or more above their 200-day moving average price line, although I have rarely used this one.
10. Selling on the way down from the top. If you didn’t sell early while the stock was still advancing, sell on the way down from the peak. After the first breakdown, some stocks may pull back up in price once.” - “Any stock that rises close to 20% should never be allowed to drop back into the loss column. If you buy a stock at $50 and it shoots up to $60 (+20%) or more, even if you don’t take the profit when you have it, there’s no intelligent reason to ever let the stock drop all the way back to $50 or below and create a loss. You may feel embarrassed, ridiculous, and not too bright if you buy at $50, watch the stock hit $60, and then sell at $50 to $51. But you’ve already made the mistake of not taking your profit. Now avoid making a second mistake by letting it develop into a loss. Remember, one important objective is to keep all your losses as small as possible.”
- “Even investors with portfolios of more than a million dollars need not own more than six or seven well-selected securities. If you’re uncomfortable and nervous with only six or seven, then own ten. But owning 30 or 40 could be a problem. The big money is made by concentration, provided you use sound buy and sell rules along with realistic general market rules.”
